
Batch inference and drift detection#
This tutorial leverages a function from the MLRun Function Hub to perform batch inference using a logged model and a new prediction dataset. The function also calculates data drift by comparing the new prediction dataset with the original training set.
Make sure you have reviewed the basics in MLRun Quick Start Tutorial.
Tutorial steps:
MLRun installation and configuration#
Before running this notebook make sure mlrun is installed and that you have configured the access to the MLRun service.
# Install MLRun if not installed, run this only once (restart the notebook after the install !!!)
%pip install mlrun
Set up a project#
First, import the dependencies and create an MLRun project. The project contains all of your models, functions, datasets, etc.:
import mlrun
import pandas as pd
project = mlrun.get_or_create_project("tutorial", context="./", user_project=True)
> 2023-09-14 11:28:28,749 [info] Loading project from path: {'project_name': 'tutorial', 'path': './'}
> 2023-09-14 11:28:44,183 [info] Project loaded successfully: {'project_name': 'tutorial', 'path': './', 'stored_in_db': True}
Note
This tutorial does not focus on training a model. Instead, it starts with a trained model and its corresponding training and prediction dataset.
You'll use the following model files and datasets to perform the batch prediction. The model is a DecisionTreeClassifier from sklearn and the datasets are in parquet format.
# We choose the correct model to avoid pickle warnings
import sys

suffix = (
    mlrun.__version__.split("-")[0].replace(".", "_")
    if sys.version_info[1] > 7
    else "3.7"
)

model_path = mlrun.get_sample_path(f"models/batch-predict/model-{suffix}.pkl")
training_set_path = mlrun.get_sample_path("data/batch-predict/training_set.parquet")
prediction_set_path = mlrun.get_sample_path("data/batch-predict/prediction_set.parquet")
View the data#
The training data has 20 numerical features and a binary (0,1) label:
pd.read_parquet(training_set_path).head()
| feature_0 | feature_1 | feature_2 | feature_3 | feature_4 | feature_5 | feature_6 | feature_7 | feature_8 | feature_9 | ... | feature_11 | feature_12 | feature_13 | feature_14 | feature_15 | feature_16 | feature_17 | feature_18 | feature_19 | label | |
|---|---|---|---|---|---|---|---|---|---|---|---|---|---|---|---|---|---|---|---|---|---|
| 0 | 0.572754 | 0.171079 | 0.403080 | 0.955429 | 0.272039 | 0.360277 | -0.995429 | 0.437239 | 0.991556 | 0.010004 | ... | 0.112194 | -0.319256 | -0.392631 | -0.290766 | 1.265054 | 1.037082 | -1.200076 | 0.820992 | 0.834868 | 0 |
| 1 | 0.623733 | -0.149823 | -1.410537 | -0.729388 | -1.996337 | -1.213348 | 1.461307 | 1.187854 | -1.790926 | -0.981600 | ... | 0.428653 | -0.503820 | -0.798035 | 2.038105 | -3.080463 | 0.408561 | 1.647116 | -0.838553 | 0.680983 | 1 |
| 2 | 0.814168 | -0.221412 | 0.020822 | 1.066718 | -0.573164 | 0.067838 | 0.923045 | 0.338146 | 0.981413 | 1.481757 | ... | -1.052559 | -0.241873 | -1.232272 | -0.010758 | 0.806800 | 0.661162 | 0.589018 | 0.522137 | -0.924624 | 0 |
| 3 | 1.062279 | -0.966309 | 0.341471 | -0.737059 | 1.460671 | 0.367851 | -0.435336 | 0.445308 | -0.655663 | -0.196220 | ... | 0.641017 | 0.099059 | 1.902592 | -1.024929 | 0.030703 | -0.198751 | -0.342009 | -1.286865 | -1.118373 | 1 |
| 4 | 0.195755 | 0.576332 | -0.260496 | 0.841489 | 0.398269 | -0.717972 | 0.810550 | -1.058326 | 0.368610 | 0.606007 | ... | 0.195267 | 0.876144 | 0.151615 | 0.094867 | 0.627353 | -0.389023 | 0.662846 | -0.857000 | 1.091218 | 1 |
5 rows × 21 columns
The prediction data has 20 numerical features, but no label - this is what you will predict:
pd.read_parquet(prediction_set_path).head()
| feature_0 | feature_1 | feature_2 | feature_3 | feature_4 | feature_5 | feature_6 | feature_7 | feature_8 | feature_9 | feature_10 | feature_11 | feature_12 | feature_13 | feature_14 | feature_15 | feature_16 | feature_17 | feature_18 | feature_19 | |
|---|---|---|---|---|---|---|---|---|---|---|---|---|---|---|---|---|---|---|---|---|
| 0 | -2.059506 | -1.314291 | 2.721516 | -2.132869 | -0.693963 | 0.376643 | 3.017790 | 3.876329 | -1.294736 | 0.030773 | 0.401491 | 2.775699 | 2.361580 | 0.173441 | 0.879510 | 1.141007 | 4.608280 | -0.518388 | 0.129690 | 2.794967 |
| 1 | -1.190382 | 0.891571 | 3.726070 | 0.673870 | -0.252565 | -0.729156 | 2.646563 | 4.782729 | 0.318952 | -0.781567 | 1.473632 | 1.101721 | 3.723400 | -0.466867 | -0.056224 | 3.344701 | 0.194332 | 0.463992 | 0.292268 | 4.665876 |
| 2 | -0.996384 | -0.099537 | 3.421476 | 0.162771 | -1.143458 | -1.026791 | 2.114702 | 2.517553 | -0.154620 | -0.465423 | -1.723025 | 1.729386 | 2.820340 | -1.041428 | -0.331871 | 2.909172 | 2.138613 | -0.046252 | -0.732631 | 4.716266 |
| 3 | -0.289976 | -1.680019 | 3.126478 | -0.704451 | -1.149112 | 1.174962 | 2.860341 | 3.753661 | -0.326119 | 2.128411 | -0.508000 | 2.328688 | 3.397321 | -0.932060 | -1.442370 | 2.058517 | 3.881936 | 2.090635 | -0.045832 | 4.197315 |
| 4 | -0.294866 | 1.044919 | 2.924139 | 0.814049 | -1.455054 | -0.270432 | 3.380195 | 2.339669 | 1.029101 | -1.171018 | -1.459395 | 1.283565 | 0.677006 | -2.147444 | -0.494150 | 3.222041 | 6.219348 | -1.914110 | 0.317786 | 4.143443 |
Log the model with training data#
Next, log the model using MLRun experiment tracking. This is usually done in a training pipeline, but you can also bring in your pre-trained models from other sources. See Working with data and model artifacts and Automated experiment tracking for more information.
In this example, you are logging a training set with the model for future comparison, however you can also directly pass in your training set to the batch prediction function.
model_artifact = project.log_model(
    key="model",
    model_file=model_path,
    framework="sklearn",
    training_set=pd.read_parquet(training_set_path),
    label_column="label",
)
# the model artifact unique URI
model_artifact.uri
'store://models/tutorial-iguazio/model#0:3ba91513-7dae-45b2-b118-d2197ade55a3'
Import and run the batch inference function#
Next, import the batch inference function from the MLRun Function Hub:
fn = mlrun.import_function("hub://batch_inference_v2")
Run batch inference#
Finally, perform the batch prediction by passing in your model and datasets. In addition, you can trigger the drift analysis batch job on the provided dataset by passing "trigger_monitoring_job": True.
If you do perform drift analysis, a new model endpoint record is generated. Model endpoint is a unique MLRun entity that includes statistics and important details about your model and function. You can perform the drift analysis on an existing model endpoint, but you need to make sure that you don't mix unrelated datasets that could affect the final drift analysis process. In general, it's recommended to perform the drift analysis on a new model endpoint to avoid possible analysis conflicts.
See the corresponding batch inference example notebook for an exhaustive list of other parameters that are supported:
run = project.run_function(
    fn,
    inputs={
        "dataset": prediction_set_path,
    },
    params={
        "model_path": model_artifact.uri,
        "perform_drift_analysis": True,
        "trigger_monitoring_job": True,
    },
)
> 2023-09-14 11:34:23,114 [info] Storing function: {'name': 'batch-inference-v2-infer', 'uid': 'bfe783edeaaa46c98d3508418deae6c2', 'db': 'http://mlrun-api:8080'}
> 2023-09-14 11:34:23,809 [info] Job is running in the background, pod: batch-inference-v2-infer-xx8zv
> 2023-09-14 11:34:27,850 [info] Loading model...
> 2023-09-14 11:34:28,573 [info] Loading data...
> 2023-09-14 11:34:30,136 [info] Calculating prediction...
> 2023-09-14 11:34:30,139 [info] Logging result set (x | prediction)...
> 2023-09-14 11:34:30,431 [info] Performing drift analysis...
> 2023-09-14 11:34:32,308 [info] Storing function: {'name': 'model-monitoring-batch', 'uid': '33b8a8e07b0542d08ac6f81f6d97f240', 'db': 'http://mlrun-api:8080'}
> 2023-09-14 11:34:32,555 [info] Job is running in the background, pod: model-monitoring-batch-lm7gd
> 2023-09-14 11:34:48,049 [info] Initializing BatchProcessor: {'project': 'tutorial-iguazio'}
divide by zero encountered in log
> 2023-09-14 11:34:48,465 [info] Drift result: {'drift_result': defaultdict(<class 'dict'>, {'feature_13': {'tvd': 0.03959999999999999, 'hellinger': 0.04519449310948248, 'kld': 0.013240526944533322}, 'tvd_sum': 5.6988, 'tvd_mean': 0.2713714285714286, 'hellinger_sum': 6.916628739424696, 'hellinger_mean': 0.3293632733059379, 'kld_sum': 39.76276059167618, 'kld_mean': 1.8934647900798178, 'feature_16': {'tvd': 0.6359999999999999, 'hellinger': 0.8003245177804857, 'kld': 4.682651890289595}, 'feature_12': {'tvd': 0.599, 'hellinger': 0.807957523155725, 'kld': 4.574238261717538}, 'feature_0': {'tvd': 0.022600000000000002, 'hellinger': 0.033573681953213544, 'kld': 0.007454628335938183}, 'label': {'tvd': 0.0456, 'hellinger': 0.032273432278649546, 'kld': 0.00833405069284858}, 'feature_7': {'tvd': 0.6646, 'hellinger': 0.7949812589747411, 'kld': 4.94920993092669}, 'feature_17': {'tvd': 0.03280000000000001, 'hellinger': 0.038955714991485355, 'kld': 0.009013894995753259}, 'feature_18': {'tvd': 0.04240000000000001, 'hellinger': 0.046474652187650754, 'kld': 0.015894237456896394}, 'feature_3': {'tvd': 0.03840000000000001, 'hellinger': 0.04913963802969945, 'kld': 0.017331946342858503}, 'feature_4': {'tvd': 0.03859999999999999, 'hellinger': 0.04691128230500036, 'kld': 0.016210210229378626}, 'feature_5': {'tvd': 0.049600000000000005, 'hellinger': 0.05408439667580992, 'kld': 0.017044292121321365}, 'feature_10': {'tvd': 0.040399999999999985, 'hellinger': 0.04473407115759961, 'kld': 0.016107595511326803}, 'feature_2': {'tvd': 0.6882, 'hellinger': 0.7900559843329186, 'kld': 5.214389130958726}, 'feature_9': {'tvd': 0.042800000000000005, 'hellinger': 0.04656727009349971, 'kld': 0.01261823423079203}, 'feature_6': {'tvd': 0.6598000000000002, 'hellinger': 0.7926084404395208, 'kld': 4.680064555912078}, 'feature_8': {'tvd': 0.038400000000000004, 'hellinger': 0.039720263747100804, 'kld': 0.009435438488007906}, 'feature_14': {'tvd': 0.038, 'hellinger': 0.05472944756352956, 'kld': 0.022306296862012256}, 'feature_1': {'tvd': 0.0434, 'hellinger': 0.046301454033261864, 'kld': 0.014581581489297469}, 'feature_11': {'tvd': 0.6384000000000001, 'hellinger': 0.8058863402254881, 'kld': 4.800461353025042}, 'feature_19': {'tvd': 0.7812000000000001, 'hellinger': 0.7993397396310429, 'kld': 6.966803905103182}, 'feature_15': {'tvd': 0.5189999999999999, 'hellinger': 0.746815136758792, 'kld': 3.715368630042354}})}
> 2023-09-14 11:34:48,465 [info] Drift status: {'endpoint_id': '66112327e1633e85ceba587c58fa0e56833bf311', 'drift_status': 'NO_DRIFT', 'drift_measure': 0.3003673509386833}
> 2023-09-14 11:34:48,473 [info] Generate a new V3IO KV schema file: {'kv_table_path': 'pipelines/tutorial-iguazio/model-endpoints/endpoints/'}
> 2023-09-14 11:34:48,494 [warning] Could not write drift measures to TSDB: {'err': Error("cannot call API - write error: backend Write failed: failed to create adapter: No TSDB schema file found at 'v3io-webapi:8081/users/pipelines/tutorial-iguazio/model-endpoints/events/'."), 'tsdb_path': 'pipelines/tutorial-iguazio/model-endpoints/events/', 'endpoint': '66112327e1633e85ceba587c58fa0e56833bf311'}
> 2023-09-14 11:34:48,494 [info] Done updating drift measures: {'endpoint_id': '66112327e1633e85ceba587c58fa0e56833bf311'}
> 2023-09-14 11:34:48,601 [info] Run execution finished: {'status': 'completed', 'name': 'model-monitoring-batch'}
> 2023-09-14 11:34:48,700 [info] To track results use the CLI: {'info_cmd': 'mlrun get run 33b8a8e07b0542d08ac6f81f6d97f240 -p tutorial-iguazio', 'logs_cmd': 'mlrun logs 33b8a8e07b0542d08ac6f81f6d97f240 -p tutorial-iguazio'}
> 2023-09-14 11:34:48,700 [info] Or click for UI: {'ui_url': 'https://dashboard.default-tenant.app.dev63.lab.iguazeng.com/mlprojects/tutorial-iguazio/jobs/monitor/33b8a8e07b0542d08ac6f81f6d97f240/overview'}
> 2023-09-14 11:34:48,701 [info] Run execution finished: {'status': 'completed', 'name': 'model-monitoring-batch'}
> 2023-09-14 11:34:50,772 [info] Run execution finished: {'status': 'completed', 'name': 'batch-inference-v2-infer'}
| project | uid | iter | start | state | name | labels | inputs | parameters | results | artifacts |
|---|---|---|---|---|---|---|---|---|---|---|
| tutorial-iguazio | 0 | Sep 14 11:34:27 | completed | batch-inference-v2-infer | v3io_user=iguazio kind=job owner=iguazio mlrun/client_version=1.5.0-rc12 mlrun/client_python_version=3.9.16 host=batch-inference-v2-infer-xx8zv |
dataset |
model_path=store://models/tutorial-iguazio/model#0:3ba91513-7dae-45b2-b118-d2197ade55a3 perform_drift_analysis=True trigger_monitoring_job=True |
batch_id=08683420069e1a367216aa745f02ef9f73a87f595a333571b417c6ac drift_status=False drift_metric=0.3003673509386833 |
prediction drift_table_plot features_drift_results |
> 2023-09-14 11:34:52,077 [info] Run execution finished: {'status': 'completed', 'name': 'batch-inference-v2-infer'}
Predictions and drift status#
These are the batch predictions on the prediction set from the model:
run.artifact("prediction").as_df().head()
| feature_0 | feature_1 | feature_2 | feature_3 | feature_4 | feature_5 | feature_6 | feature_7 | feature_8 | feature_9 | ... | feature_11 | feature_12 | feature_13 | feature_14 | feature_15 | feature_16 | feature_17 | feature_18 | feature_19 | label | |
|---|---|---|---|---|---|---|---|---|---|---|---|---|---|---|---|---|---|---|---|---|---|
| 0 | -2.059506 | -1.314291 | 2.721516 | -2.132869 | -0.693963 | 0.376643 | 3.017790 | 3.876329 | -1.294736 | 0.030773 | ... | 2.775699 | 2.361580 | 0.173441 | 0.879510 | 1.141007 | 4.608280 | -0.518388 | 0.129690 | 2.794967 | 0 |
| 1 | -1.190382 | 0.891571 | 3.726070 | 0.673870 | -0.252565 | -0.729156 | 2.646563 | 4.782729 | 0.318952 | -0.781567 | ... | 1.101721 | 3.723400 | -0.466867 | -0.056224 | 3.344701 | 0.194332 | 0.463992 | 0.292268 | 4.665876 | 1 |
| 2 | -0.996384 | -0.099537 | 3.421476 | 0.162771 | -1.143458 | -1.026791 | 2.114702 | 2.517553 | -0.154620 | -0.465423 | ... | 1.729386 | 2.820340 | -1.041428 | -0.331871 | 2.909172 | 2.138613 | -0.046252 | -0.732631 | 4.716266 | 0 |
| 3 | -0.289976 | -1.680019 | 3.126478 | -0.704451 | -1.149112 | 1.174962 | 2.860341 | 3.753661 | -0.326119 | 2.128411 | ... | 2.328688 | 3.397321 | -0.932060 | -1.442370 | 2.058517 | 3.881936 | 2.090635 | -0.045832 | 4.197315 | 0 |
| 4 | -0.294866 | 1.044919 | 2.924139 | 0.814049 | -1.455054 | -0.270432 | 3.380195 | 2.339669 | 1.029101 | -1.171018 | ... | 1.283565 | 0.677006 | -2.147444 | -0.494150 | 3.222041 | 6.219348 | -1.914110 | 0.317786 | 4.143443 | 1 |
5 rows × 21 columns
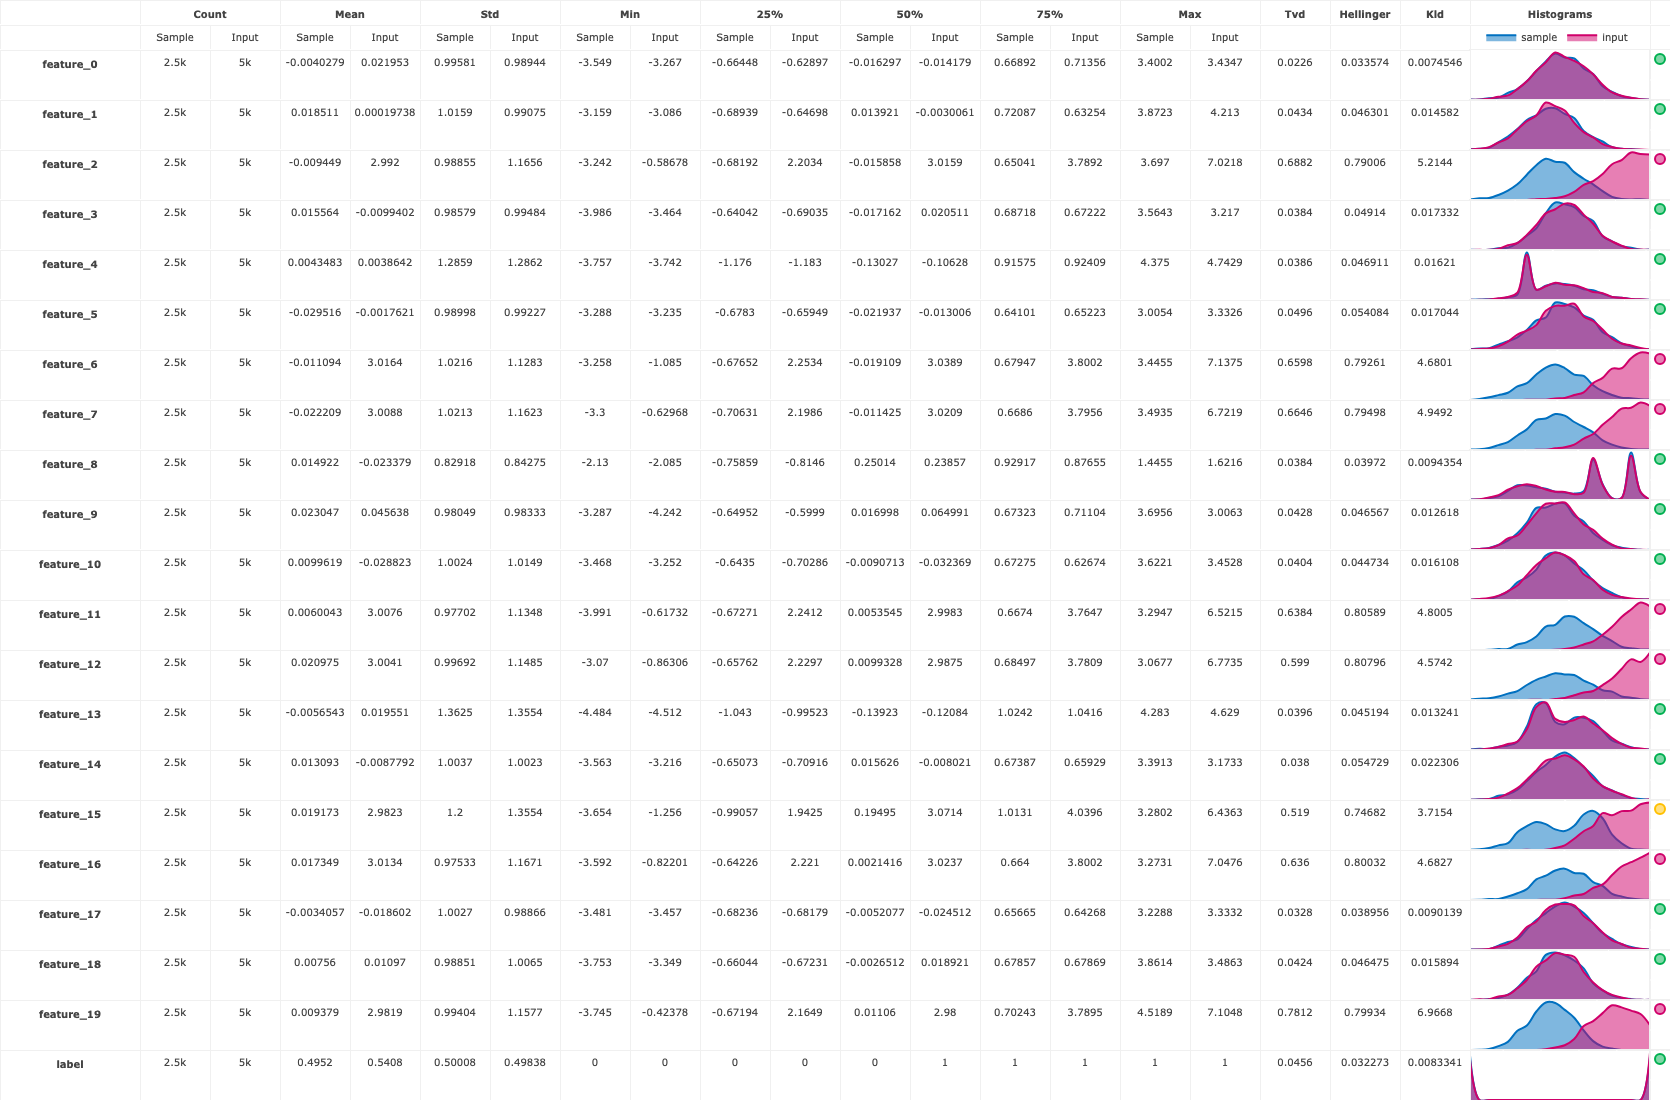
There is also a drift table plot that compares the drift between the training data and prediction data per feature:
run.artifact("drift_table_plot").show()
Finally, you also get a numerical drift metric and boolean flag denoting whether or not data drift is detected:
run.status.results
{'batch_id': '08683420069e1a367216aa745f02ef9f73a87f595a333571b417c6ac',
 'drift_status': False,
 'drift_metric': 0.3003673509386833}
# Data/concept drift per feature
import json

json.loads(run.artifact("features_drift_results").get())
{'feature_13': 0.04239724655474124,
 'feature_16': 0.7181622588902428,
 'feature_12': 0.7034787615778625,
 'feature_0': 0.028086840976606773,
 'label': 0.03893671613932477,
 'feature_7': 0.7297906294873706,
 'feature_17': 0.03587785749574268,
 'feature_18': 0.04443732609382538,
 'feature_3': 0.043769819014849734,
 'feature_4': 0.042755641152500176,
 'feature_5': 0.05184219833790496,
 'feature_10': 0.042567035578799796,
 'feature_2': 0.7391279921664593,
 'feature_9': 0.04468363504674985,
 'feature_6': 0.7262042202197605,
 'feature_8': 0.039060131873550404,
 'feature_14': 0.046364723781764774,
 'feature_1': 0.04485072701663093,
 'feature_11': 0.7221431701127441,
 'feature_19': 0.7902698698155215,
 'feature_15': 0.6329075683793959}
Examining the drift results in the dashboard#
This section reviews the main charts and statistics that can be found on the platform dashboard. See Model monitoring overview to learn more about the available model monitoring features and how to use them.
Before analyzing the results in the visual dashboards, run another batch infer job, but this time with a lower drift threshold, to get a drifted result. The drift decision rule is the value per-feature mean of the Total Variance Distance (TVD) and Hellinger distance scores. By default, the threshold is 0.7 but you can modify it through the batch infer process. As seen above, the drift result in this case was ~0.3. Reduce the threshold value to 0.2 in the following run to generate the drifted result:
run = project.run_function(
    fn,
    inputs={
        "dataset": prediction_set_path,
    },
    params={
        "model_path": model_artifact.uri,
        "perform_drift_analysis": True,
        "trigger_monitoring_job": True,
        "model_endpoint_name": "drifted-model-endpoint",
        "model_endpoint_drift_threshold": 0.2,
        "model_endpoint_possible_drift_threshold": 0.1,
    },
)
> 2023-09-14 14:00:21,477 [info] Storing function: {'name': 'batch-inference-v2-infer', 'uid': '02af70631bbe4d7aaec58cbef4bf725d', 'db': 'http://mlrun-api:8080'}
> 2023-09-14 14:00:21,796 [info] Job is running in the background, pod: batch-inference-v2-infer-vthxf
> 2023-09-14 14:00:45,833 [info] Loading model...
> 2023-09-14 14:00:46,530 [info] Loading data...
> 2023-09-14 14:00:55,812 [info] Calculating prediction...
> 2023-09-14 14:00:55,816 [info] Logging result set (x | prediction)...
> 2023-09-14 14:00:56,120 [info] Performing drift analysis...
> 2023-09-14 14:00:57,897 [info] Storing function: {'name': 'model-monitoring-batch', 'uid': '7e3fa8d0dd12430d8b1934fdf76b6720', 'db': 'http://mlrun-api:8080'}
> 2023-09-14 14:00:58,138 [info] Job is running in the background, pod: model-monitoring-batch-6hcb8
> 2023-09-14 14:01:13,295 [info] Initializing BatchProcessor: {'project': 'tutorial-iguazio'}
divide by zero encountered in log
> 2023-09-14 14:01:13,741 [info] Drift result: {'drift_result': defaultdict(<class 'dict'>, {'feature_8': {'tvd': 0.038400000000000004, 'hellinger': 0.039720263747100804, 'kld': 0.009435438488007906}, 'tvd_sum': 5.6988, 'tvd_mean': 0.2713714285714286, 'hellinger_sum': 6.916628739424697, 'hellinger_mean': 0.32936327330593795, 'kld_sum': 39.76276059167616, 'kld_mean': 1.8934647900798172, 'label': {'tvd': 0.0456, 'hellinger': 0.032273432278649546, 'kld': 0.00833405069284858}, 'feature_14': {'tvd': 0.038, 'hellinger': 0.05472944756352956, 'kld': 0.022306296862012256}, 'feature_1': {'tvd': 0.0434, 'hellinger': 0.046301454033261864, 'kld': 0.014581581489297469}, 'feature_0': {'tvd': 0.022600000000000002, 'hellinger': 0.033573681953213544, 'kld': 0.007454628335938183}, 'feature_2': {'tvd': 0.6882, 'hellinger': 0.7900559843329186, 'kld': 5.214389130958726}, 'feature_15': {'tvd': 0.5189999999999999, 'hellinger': 0.746815136758792, 'kld': 3.715368630042354}, 'feature_17': {'tvd': 0.03280000000000001, 'hellinger': 0.038955714991485355, 'kld': 0.009013894995753259}, 'feature_12': {'tvd': 0.599, 'hellinger': 0.807957523155725, 'kld': 4.574238261717538}, 'feature_11': {'tvd': 0.6384000000000001, 'hellinger': 0.8058863402254881, 'kld': 4.800461353025042}, 'feature_18': {'tvd': 0.04240000000000001, 'hellinger': 0.046474652187650754, 'kld': 0.015894237456896394}, 'feature_9': {'tvd': 0.042800000000000005, 'hellinger': 0.04656727009349971, 'kld': 0.01261823423079203}, 'feature_10': {'tvd': 0.040399999999999985, 'hellinger': 0.04473407115759961, 'kld': 0.016107595511326803}, 'feature_16': {'tvd': 0.6359999999999999, 'hellinger': 0.8003245177804857, 'kld': 4.682651890289595}, 'feature_5': {'tvd': 0.049600000000000005, 'hellinger': 0.05408439667580992, 'kld': 0.017044292121321365}, 'feature_13': {'tvd': 0.03959999999999999, 'hellinger': 0.04519449310948248, 'kld': 0.013240526944533322}, 'feature_4': {'tvd': 0.03859999999999999, 'hellinger': 0.04691128230500036, 'kld': 0.016210210229378626}, 'feature_19': {'tvd': 0.7812000000000001, 'hellinger': 0.7993397396310429, 'kld': 6.966803905103182}, 'feature_3': {'tvd': 0.03840000000000001, 'hellinger': 0.04913963802969945, 'kld': 0.017331946342858503}, 'feature_7': {'tvd': 0.6646, 'hellinger': 0.7949812589747411, 'kld': 4.94920993092669}, 'feature_6': {'tvd': 0.6598000000000002, 'hellinger': 0.7926084404395208, 'kld': 4.680064555912078}})}
> 2023-09-14 14:01:13,741 [info] Drift status: {'endpoint_id': '4a68274cf8a733c9ea3c4497a9fe24cf623e378f', 'drift_status': 'DRIFT_DETECTED', 'drift_measure': 0.3003673509386833}
> 2023-09-14 14:01:13,791 [warning] Could not write drift measures to TSDB: {'err': Error("cannot call API - write error: backend Write failed: failed to create adapter: No TSDB schema file found at 'v3io-webapi:8081/users/pipelines/tutorial-iguazio/model-endpoints/events/'."), 'tsdb_path': 'pipelines/tutorial-iguazio/model-endpoints/events/', 'endpoint': '4a68274cf8a733c9ea3c4497a9fe24cf623e378f'}
> 2023-09-14 14:01:13,792 [info] Done updating drift measures: {'endpoint_id': '4a68274cf8a733c9ea3c4497a9fe24cf623e378f'}
> 2023-09-14 14:01:13,889 [info] Run execution finished: {'status': 'completed', 'name': 'model-monitoring-batch'}
> 2023-09-14 14:01:14,265 [info] To track results use the CLI: {'info_cmd': 'mlrun get run 7e3fa8d0dd12430d8b1934fdf76b6720 -p tutorial-iguazio', 'logs_cmd': 'mlrun logs 7e3fa8d0dd12430d8b1934fdf76b6720 -p tutorial-iguazio'}
> 2023-09-14 14:01:14,265 [info] Or click for UI: {'ui_url': 'https://dashboard.default-tenant.app.dev63.lab.iguazeng.com/mlprojects/tutorial-iguazio/jobs/monitor/7e3fa8d0dd12430d8b1934fdf76b6720/overview'}
> 2023-09-14 14:01:14,265 [info] Run execution finished: {'status': 'completed', 'name': 'model-monitoring-batch'}
> 2023-09-14 14:01:16,296 [info] Run execution finished: {'status': 'completed', 'name': 'batch-inference-v2-infer'}
| project | uid | iter | start | state | name | labels | inputs | parameters | results | artifacts |
|---|---|---|---|---|---|---|---|---|---|---|
| tutorial-iguazio | 0 | Sep 14 14:00:45 | completed | batch-inference-v2-infer | v3io_user=iguazio kind=job owner=iguazio mlrun/client_version=1.5.0-rc12 mlrun/client_python_version=3.9.16 host=batch-inference-v2-infer-vthxf |
dataset |
model_path=store://models/tutorial-iguazio/model#0:3ba91513-7dae-45b2-b118-d2197ade55a3 perform_drift_analysis=True trigger_monitoring_job=True model_endpoint_name=drifted-model-endpoint model_endpoint_drift_threshold=0.2 model_endpoint_possible_drift_threshold=0.1 |
batch_id=7e505020685f41b05b2fa191977a085c8d47e89cfef145d1626c0284 drift_status=True drift_metric=0.3003673509386833 |
prediction drift_table_plot features_drift_results |
> 2023-09-14 14:01:20,495 [info] Run execution finished: {'status': 'completed', 'name': 'batch-inference-v2-infer'}
Now you can observe the drift result:
run.status.results
{'batch_id': '7e505020685f41b05b2fa191977a085c8d47e89cfef145d1626c0284',
 'drift_status': True,
 'drift_metric': 0.3003673509386833}
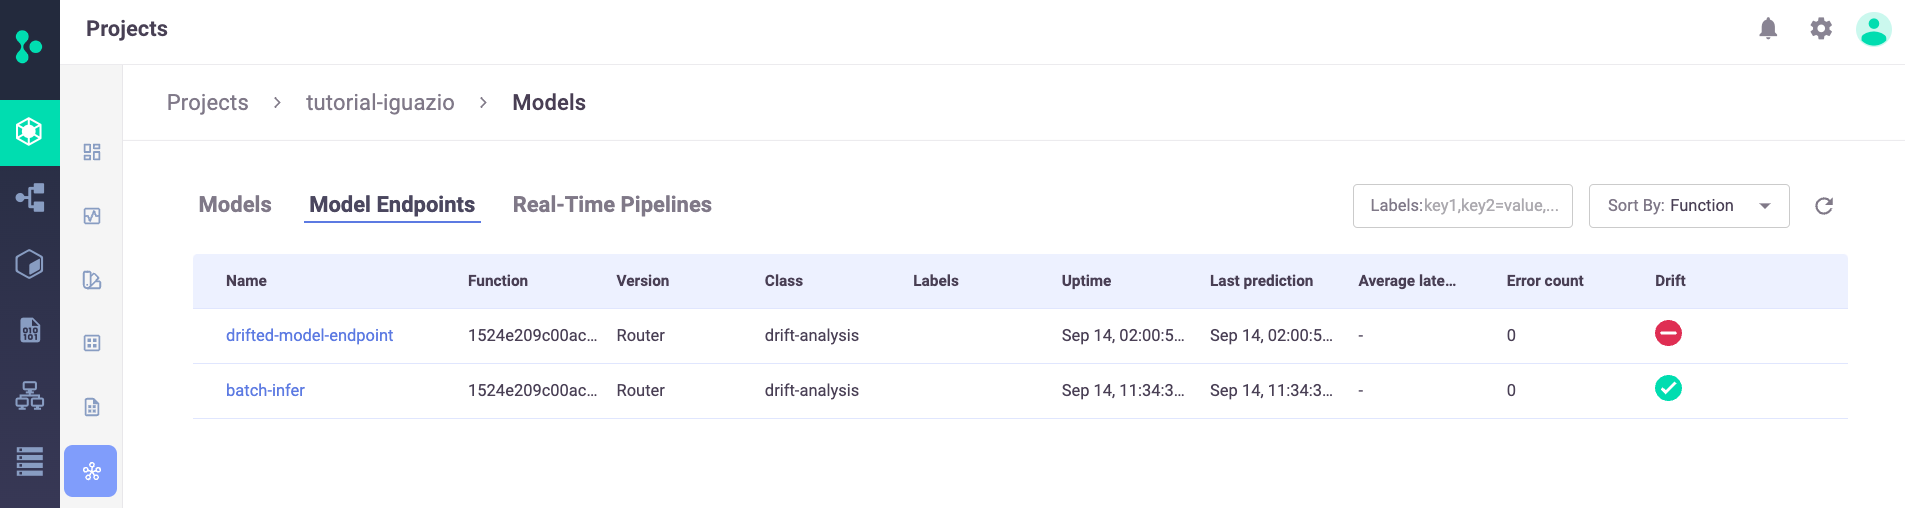
Model Endpoints#
In the Projects page > Model endpoint summary list, you can see the new two model endpoints, including their drift status:
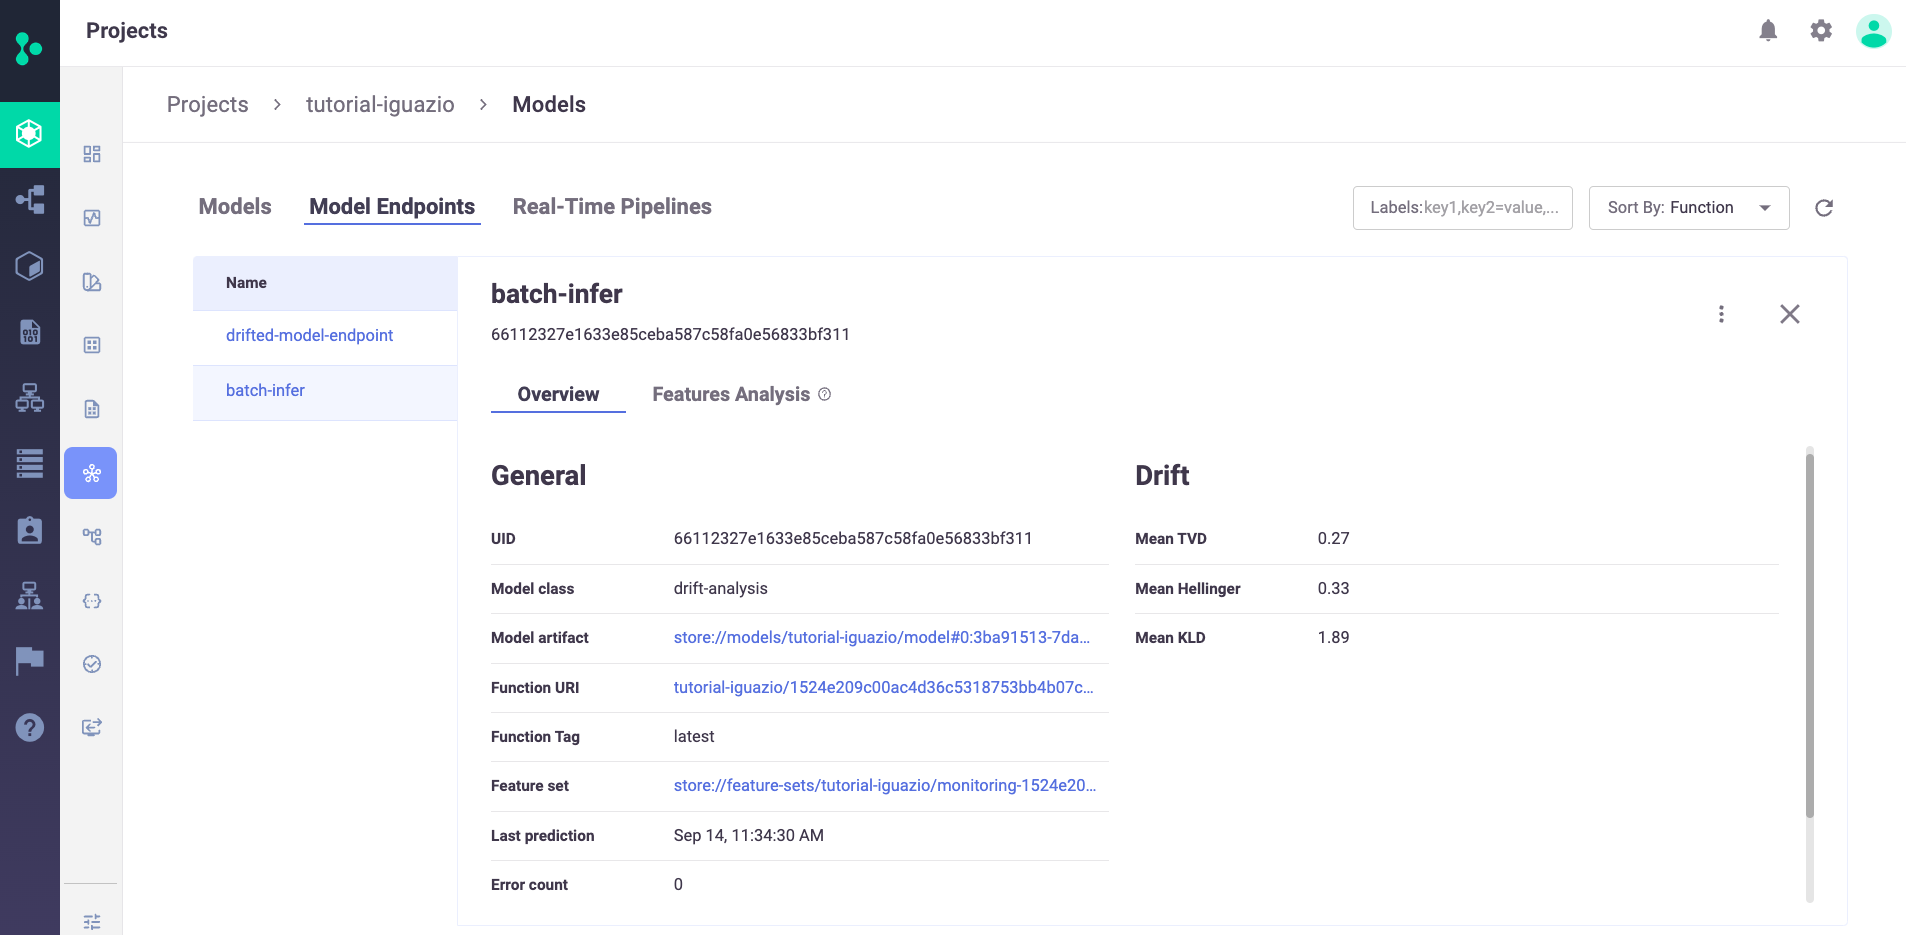
You can zoom into one of the model endpoints to get an overview about the selected endpoint, including the calculated statistical drift metrics:
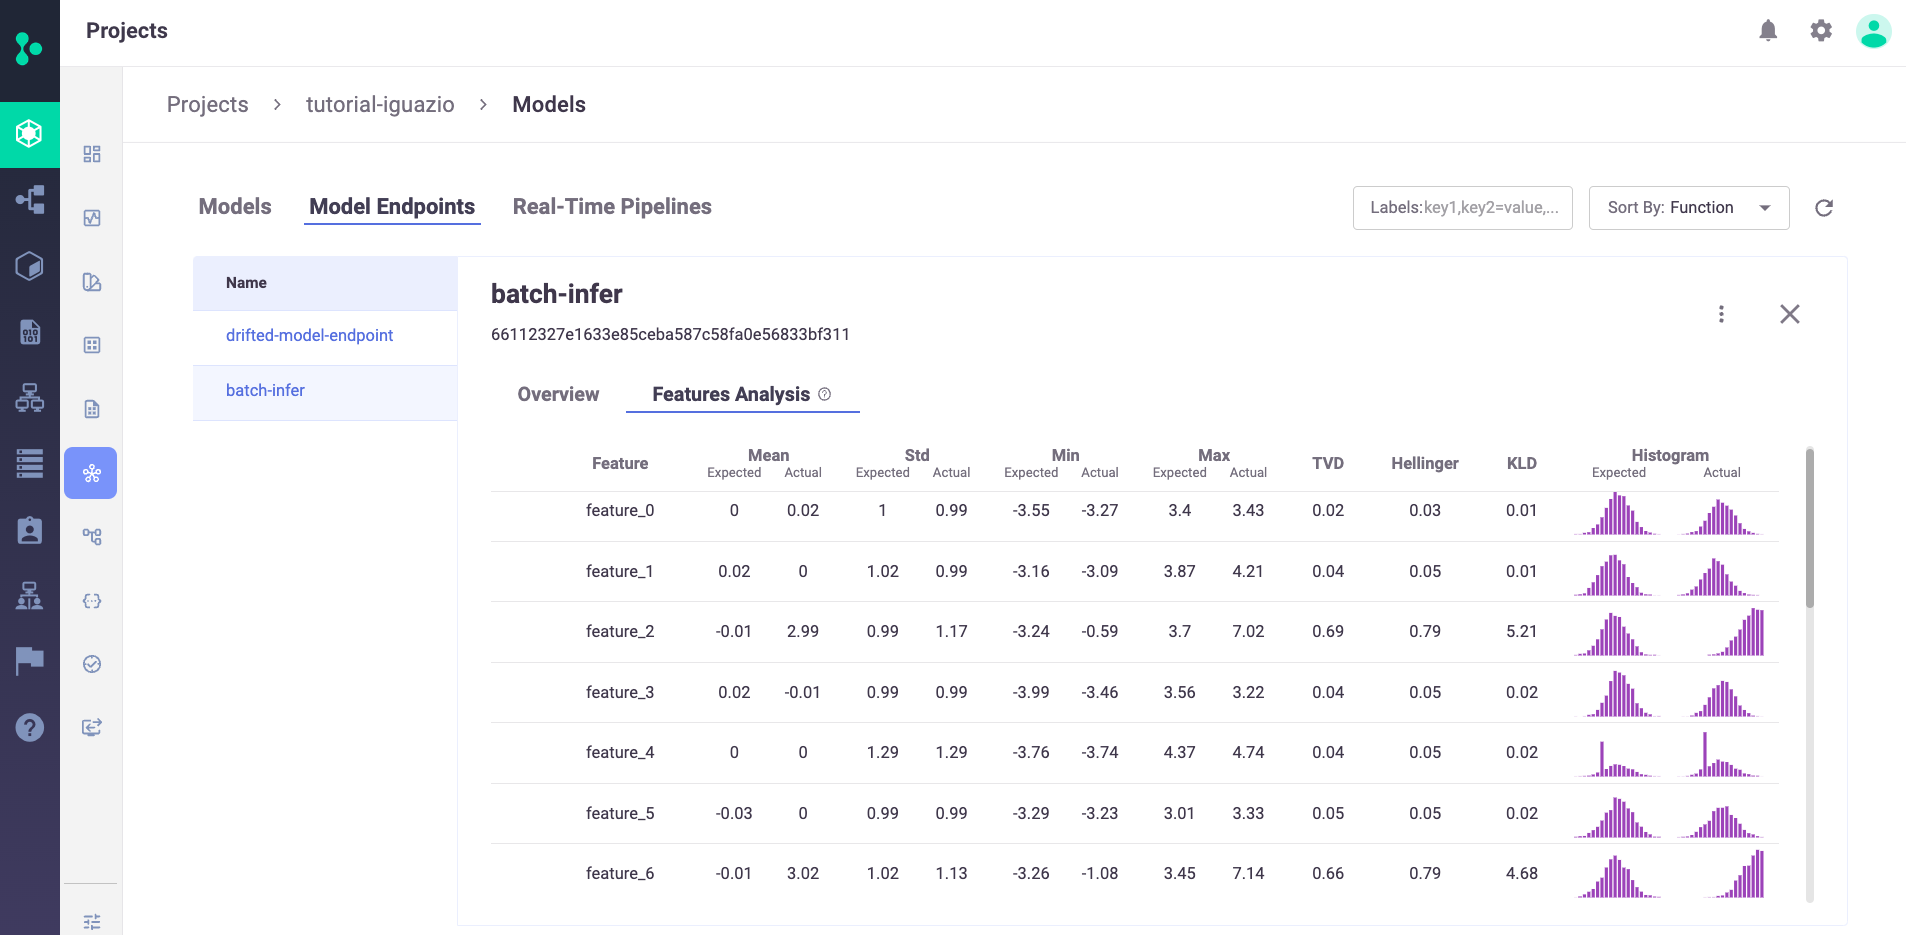
Press Features Analysis to see details of the drift analysis in a table format with each feature in the selected model on its own line, including the predicted label:
Next steps#
In a production setting, you probably want to incorporate this as part of a larger pipeline or application.
For example, if you use this function for the prediction capabilities, you can pass the prediction output as the input to another pipeline step, store it in an external location like S3, or send to an application or user.
If you use this function for the drift detection capabilities, you can use the drift_status and drift_metrics outputs to automate further pipeline steps, send a notification, or kick off a re-training pipeline.