Model monitoring tutorial#
This tutorial illustrates the basic model monitoring capabilities of MLRun: deploying a model to a live endpoint (model monitoring endpoint); deploying two model-monitoring applications, one of them based on the Evidently service / OSS; configuring alerts on data-drift; exercising the deployment with invocations, and viewing the calculated drift results and the UI feedback, and the triggered alerts.
Make sure you went over the basics in MLRun Quick Start Tutorial.
In this tutorial:
See also
Preparations#
Import mlrun and Evidently. Then install the Evidently package (restart the kernel after install).
{admonition}Note
If Evidently is already installed, comment out the install command. If not, run the Evidently install command once, comment it out, and then restart the notebook.
import mlrun
import os

# Install and use a version of evidently that was tested to be working with mlrun
from mlrun.model_monitoring.applications.evidently import SUPPORTED_EVIDENTLY_VERSION

# run this only once
%pip install "evidently=={SUPPORTED_EVIDENTLY_VERSION}"
Requirement already satisfied: evidently==0.7.5 in /User/.conda/envs/daniel311/lib/python3.11/site-packages (0.7.5)
Requirement already satisfied: faker>=5.0.0 in /User/.conda/envs/daniel311/lib/python3.11/site-packages (from polyfactory>=2.6.3->litestar>=2.8.3->evidently==0.7.5) (37.8.0)
Requirement already satisfied: six>=1.5 in /User/.conda/envs/daniel311/lib/python3.11/site-packages (from python-dateutil>=2.8.2->pandas>=1.3.5->pandas[parquet]>=1.3.5->evidently==0.7.5) (1.17.0)
Create your MLRun project.
Note
If you want to use S3 storage, see Data store: S3.
project = mlrun.get_or_create_project(
    "tutorial", context="./", user_project=True, allow_cross_project=True
)

# Backward compatibility: Support both S3_ENDPOINT_URL (deprecated) and AWS_ENDPOINT_URL_S3
# TODO: Remove this in 1.12.0
aws_url = os.environ.get("AWS_ENDPOINT_URL_S3") or os.environ.get("S3_ENDPOINT_URL")
if aws_url:
    os.environ["AWS_ENDPOINT_URL_S3"] = aws_url
    project.set_secrets({"AWS_ENDPOINT_URL_S3": aws_url})
> 2025-09-21 09:36:48,831 [info] Project loaded successfully: {"project_name":"tutorial-admin"}
Set datastore profiles#
A datastore profile holds all the information required to address an external data source, including credentials. Before you enable model monitoring, you must configure datastore profiles for TSDB and streaming platforms:
TSDB (time series database) stores, retrieves, and analyzes time-stamped data, such as model predictions statistics or monitoring application metrics.
Streaming platforms are used to deliver data continuously and efficiently. In the model monitoring infrastructure, they are used for the data flow between Nuclio functions, supporting real-time processing and enabling event-driven operations.
Model monitoring supports Kafka and V3IO as streaming platforms, and TimescaleDB (PostgreSQL) and V3IO as TSDB platforms.
After you configure and save the datastore profiles under your project, you need to call the set_model_monitoring_credentials API to register them with the model monitoring resources. (In this tutorial the set_model_monitoring_credentials API is wrapped under the helper enable_model_monitoring that is in the src.model_monitoring_utils.) See set_model_monitoring_credentials for more details.
Enable model monitoring#
from src.model_monitoring_utils import enable_model_monitoring
Note
If this project was running with model monitoring enabled in a pre-1.8.0 version, disable the old model monitoring to update the configurations:
project.disable_model_monitoring(delete_stream_function=True)
enable_model_monitoring(project=project)
Log the model artifact#
This tutorial uses an existing MLRun dataset for training. You just need to specify it.
Then you can log the model. See the parameter descriptions in log_model.
# If this project was running with MM enabled, disable the old model monitoring to update configurations with the line below
project.disable_model_monitoring(delete_stream_function=True)
enable_model_monitoring(project=project)
> 2025-09-21 09:36:49,106 [info] Model monitoring credentials were set successfully. Please keep in mind that if you already had model monitoring functions / model monitoring infra / tracked model server deployed on your project, you will need to redeploy them. For redeploying the model monitoring infra, first disable it using `project.disable_model_monitoring()` and then enable it using `project.enable_model_monitoring()`.
<mlrun.projects.project.MlrunProject at 0x7fed5eb8fad0>
Tip
You can also pass lag_threshold and lag_event_cooldown (in minutes) to
enable_model_monitoring to enable lag detection — alerts when the monitoring
writer falls behind processing inference events. See Lag detection alerts for details.
# Download the training set
import pandas as pd

train_set = pd.read_csv(
    "https://s3.us-east-1.wasabisys.com/iguazio/data/iris/iris_dataset.csv"
)

# Log the model
model_name = "RandomForestClassifier"
model_artifact = project.log_model(
    model_name,
    model_file="src/model.pkl",
    training_set=train_set,
    framework="sklearn",
    label_column="label",
)
Import, enable monitoring, and deploy the serving function#
Use the v2_model_server serving function from the MLRun hub. This function tests one or more classifier models against a held-out dataset.
Add the model to the serving function's routing spec add_model(),
enable monitoring on the serving function set_tracking(),
and then deploy the function deploy_function().
# Import the serving function
serving_fn = mlrun.import_function(
    "hub://v2_model_server", project=project.name, new_name="monitoring-serving"
)

serving_fn.add_model(model_name, model_path=model_artifact.uri)

# enable monitoring on this serving function
serving_fn.set_tracking()

serving_fn.spec.build.requirements = ["scikit-learn~=1.5.2"]

# Deploy the serving function
project.deploy_function(serving_fn)
> 2025-09-21 09:36:50,729 [info] Starting remote function deploy
2025-09-21 09:36:51  (info) Deploying function
2025-09-21 09:36:51  (info) Building
2025-09-21 09:36:51  (info) Staging files and preparing base images
2025-09-21 09:36:51  (warn) Using user provided base image, runtime interpreter version is provided by the base image
2025-09-21 09:36:51  (info) Building processor image
2025-09-21 09:38:36  (info) Build complete
2025-09-21 09:38:44  (info) Function deploy complete
> 2025-09-21 09:38:51,786 [info] Model endpoint creation task completed with state succeeded
> 2025-09-21 09:38:51,787 [info] Successfully deployed function: {"external_invocation_urls":["tutorial-admin-monitoring-serving.default-tenant.app.vmdev91.lab.iguazeng.com/"],"internal_invocation_urls":["nuclio-tutorial-admin-monitoring-serving.default-tenant.svc.cluster.local:8080"]}
DeployStatus(state=ready, outputs={'endpoint': 'http://tutorial-admin-monitoring-serving.default-tenant.app.vmdev91.lab.iguazeng.com/', 'name': 'tutorial-admin-monitoring-serving'})
Invoke the model#
Invoke the model function with invoke().
import json
from time import sleep
from random import choice

iris_data = pd.read_csv(
    "https://s3.us-east-1.wasabisys.com/iguazio/data/iris/iris_to_predict.csv"
)
iris_data = iris_data.to_numpy().tolist()

model_name = "RandomForestClassifier"
serving_1 = project.get_function("monitoring-serving")
Test your serving model function
data_point = choice(iris_data)
serving_1.invoke(f"v2/models/{model_name}/infer", json.dumps({"inputs": [data_point]}))
{'id': 'f3d62d27-b5f3-47ef-8ecd-03d618d1573c',
 'model_name': 'RandomForestClassifier',
 'outputs': [1],
 'timestamp': '2025-09-21 09:38:53.028889+00:00',
 'model_endpoint_uid': 'ddb24846b6f24bbba6410e98f3bc6ced'}
After invoking the model, you can see the model endpoints and minimal meta data (for example, last prediction) in the Models | Model Endpoints page.

You can also see the basic statistics in Grafana.
Register and deploy the model monitoring app#
The next step is to deploy the model-monitoring app to generate the full meta data.
Add the monitoring function to the project using set_model_monitoring_function().
Then, deploy the function using deploy_function().
This tutorial illustrates two monitoring apps:
The first application is a custom monitoring app (code provided).
The second application integrates with Evidently and captures its results as MLRun artifacts.
Learn how to write your own app in Writing a model monitoring application.
After deploying the apps they show in the UI under Real-time functions (Nuclio).
Deploying a monitoring app#
Set and deploy a monitoring application.
If you're not using Iguazio's Jupyter, download demo_app.py.
Note
You can also import model monitoring applications from the MLRun hub. Each application has complete usage instructions.
my_app = project.set_model_monitoring_function(
    func="src/demo_app.py",
    application_class="DemoMonitoringApp",
    name="myApp",
)

project.deploy_function(my_app)
> 2025-09-21 09:38:53,076 [info] Starting remote function deploy
2025-09-21 09:38:53  (info) Deploying function
2025-09-21 09:38:53  (info) Building
2025-09-21 09:38:53  (info) Staging files and preparing base images
2025-09-21 09:38:53  (warn) Using user provided base image, runtime interpreter version is provided by the base image
2025-09-21 09:38:53  (info) Building processor image
2025-09-21 09:40:28  (info) Build complete
2025-09-21 09:40:38  (info) Function deploy complete
> 2025-09-21 09:40:44,164 [info] Model endpoint creation task completed with state succeeded
> 2025-09-21 09:40:44,164 [info] Successfully deployed function: {"external_invocation_urls":[],"internal_invocation_urls":["nuclio-tutorial-admin-myapp.default-tenant.svc.cluster.local:8080"]}
DeployStatus(state=ready, outputs={'endpoint': 'http://nuclio-tutorial-admin-myapp.default-tenant.svc.cluster.local:8080', 'name': 'tutorial-admin-myapp'})
To retrieve a list of the model monitoring functions, run list_model_monitoring_functions.
For example: functions = project.list_model_monitoring_functions(),
Deploying an Evidently-based app#
You can use the MLRun built-in class, EvidentlyModelMonitoringApplicationBase, to integrate Evidently as an MLRun function and create MLRun artifacts.
As a prerequsite, you need to have an Evidently workspace and project. If you don't have one, create it now:
import os
import uuid
from src.evidently_app_setup import setup_evidently_project

evidently_workspace_path = os.path.join(
    mlrun.mlconf.artifact_path.replace("{{run.project}}", project.name),
    "evidently_workspace",
)

evidently_project_id = str(uuid.uuid4())
setup_evidently_project(
    evidently_project_id=evidently_project_id,
    evidently_workspace_path=evidently_workspace_path,
)
And now continue with registering the model.
# register the second app named "evidently_app"

my_evidently_app = project.set_model_monitoring_function(
    func="src/evidently_app.py",
    image="mlrun/mlrun",
    requirements=[
        f"evidently=={SUPPORTED_EVIDENTLY_VERSION}",
    ],
    name="MyEvidentlyApp",
    application_class="DemoEvidentlyMonitoringApp",
    evidently_workspace_path=evidently_workspace_path,
    evidently_project_id=evidently_project_id,
)

project.deploy_function(my_evidently_app)
> 2025-09-21 09:40:44,331 [info] Starting remote function deploy
2025-09-21 09:40:44  (info) Deploying function
2025-09-21 09:40:44  (info) Building
2025-09-21 09:40:44  (info) Staging files and preparing base images
2025-09-21 09:40:44  (warn) Using user provided base image, runtime interpreter version is provided by the base image
2025-09-21 09:40:44  (info) Building processor image
2025-09-21 09:43:00  (info) Build complete
2025-09-21 09:43:20  (info) Function deploy complete
> 2025-09-21 09:43:25,905 [info] Model endpoint creation task completed with state succeeded
> 2025-09-21 09:43:25,906 [info] Successfully deployed function: {"external_invocation_urls":[],"internal_invocation_urls":["nuclio-tutorial-admin-myevidentlyapp.default-tenant.svc.cluster.local:8080"]}
DeployStatus(state=ready, outputs={'endpoint': 'http://nuclio-tutorial-admin-myevidentlyapp.default-tenant.svc.cluster.local:8080', 'name': 'tutorial-admin-myevidentlyapp'})
Configure alerts#
The monitoring infrastructure can trigger alerts when an event occurs. This alert occurs for the results on the model endpoints that are created by the evidently app.
Define the notification#
First define the notification. Define the notification list to send when the alert occurs. The example below creates a single Slack notification. Note that this is an illustrative example. In an actual implementation you need to create a slack webhook with a unique URL and pass that secret as a parameter. See full details in Notifications.
notification = mlrun.model.Notification(
    kind="slack",
    name="slack_notification",
    secret_params={
        "webhook": "https://hooks.slack.com/",
    },
).to_dict()

# Construct a list of notifications to be included in the alert config
notifications = [
    mlrun.common.schemas.alert.AlertNotification(notification=notification)
]
Define the alert object#
Create the alert configuration and store it in the project. The next time this event is detected, you will see an alert activation. See more details in Alerts.
alert_configs = project.create_model_monitoring_alert_configs(
    # Name of the AlertConfig template
    name="drift-alert-suspected",
    summary="user_template_summary_EventKind.DATA_DRIFT_SUSPECTED",
    # Retrieve metrics from these endpoints to configure the alert
    endpoints=project.list_model_endpoints(),
    # AlertTrigger event type
    events=[mlrun.common.schemas.alert.EventKind.DATA_DRIFT_SUSPECTED],
    notifications=notifications,
    result_names=[],  # Can use wildcards
    severity=mlrun.common.schemas.alert.AlertSeverity.LOW,
    criteria=None,
    reset_policy=mlrun.common.schemas.alert.ResetPolicy.MANUAL,
)
for alert_config in alert_configs:
    project.store_alert_config(alert_config)
Configure a lag detection alert#
In addition to data-drift alerts, you can configure an alert that fires when the monitoring writer falls behind — i.e., when the events it processes carry inference timestamps older than a configurable threshold. This is especially useful when monitoring many endpoints, where processing delays can go unnoticed.
The lag alert reuses the same notification you already defined above:
# Configure lag alert with the same Slack notification
project.set_model_monitoring_lag_alert(
    notifications=mlrun.common.schemas.Notification(
        kind="slack",
        name="lag-slack",
        secret_params={
            "webhook": "https://hooks.slack.com/",
        },
    )
)
To remove the lag alert later, call project.delete_model_monitoring_lag_alert().
Construct a unique ID for the event ID using the endpoint, application name and result name:
# Get the endpoint
endpoint = (
    mlrun.get_run_db()
    .list_model_endpoints(
        project=project.name,
        function_name="monitoring-serving",
        model_name="RandomForestClassifier",
    )
    .endpoints[0]
)
app_name = "MyEvidentlyApp"
result_name = "data_drift_test"

# Construct the unique ID for the event ID
result_endpoint = f"{endpoint.metadata.uid}.{app_name}.result.{result_name}"
Generate traffic against the serving function model#
for i in range(1000):
    data_point = choice(iris_data)
    serving_1.invoke(
        f"v2/models/{model_name}/infer", json.dumps({"inputs": [data_point]})
    )
    sleep(choice([0.01, 0.04]))
View model monitoring artifacts and drift in the UI#
Now you can view the monitoring application results by clicking on the project Artifacts tab:

And if you've used Evidently:


For more information on the UI, see Model monitoring using the platform UI.
View model monitoring artifacts and drift in Grafana#
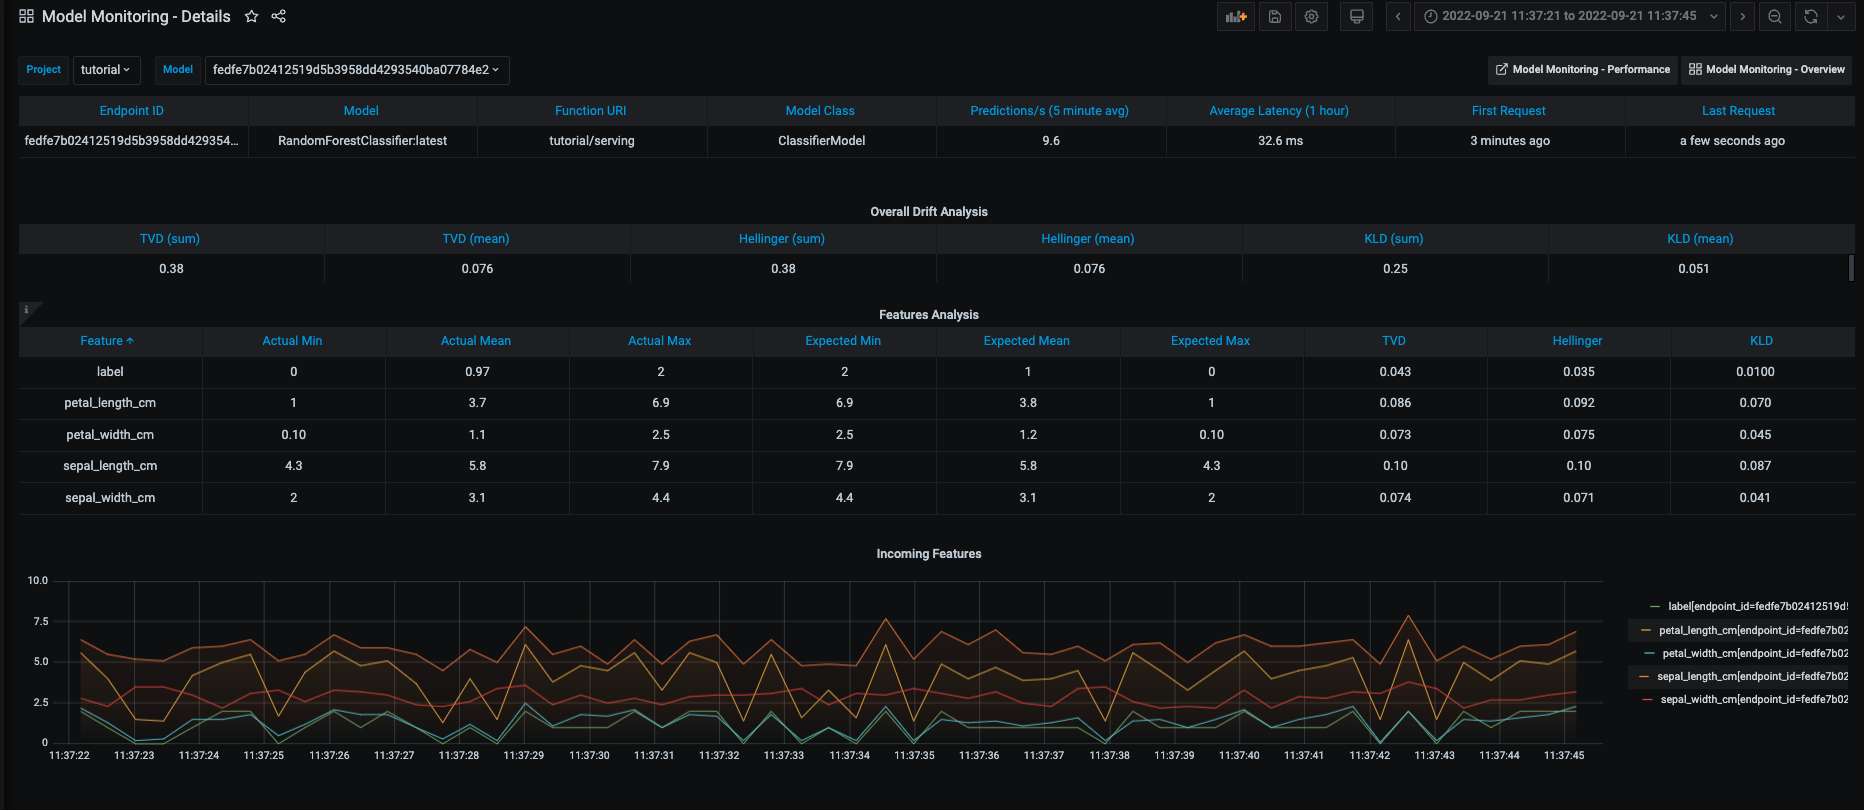
Monitoring details:
And drift and operational metrics over time:
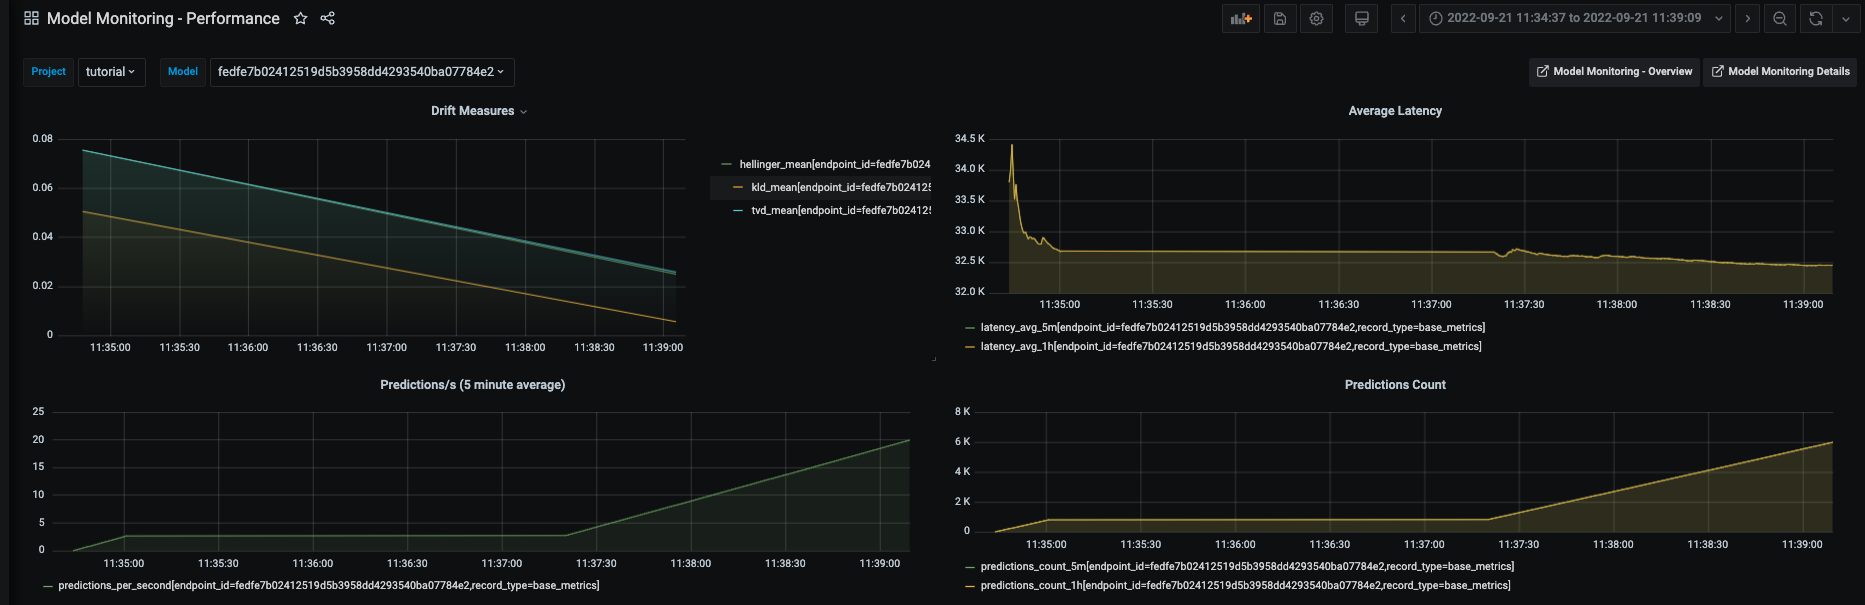
All of the Grafana dashboards are described in View model monitoring results in Grafana.
Batch infer model-monitoring#
You can use the batch function stored in the MLRun hub to evaluate data against your logged model without disturbing the model, for example a one-time evaluation of new data.
See more in Batch_inference and Batch inference and drift detection tutorial.
Done!#
Congratulations! You've completed Part 5 of the MLRun getting-started tutorial. Proceed to Part 6: Batch inference and drift detection to learn how to perform batch inference using a logged model and a prediction dataset.