Monitor an externally-served model over HTTP#
MLRun model monitoring can track models that are served through a plain Nuclio
function, a Flask / FastAPI app, or a service on a different cluster (as opposed to
models served through mlrun.serving). This page shows how to give those models
the same drift and performance tracking in the MLRun UI by:
Registering a user-defined model endpoint (
USER_EP), andStreaming prediction events into MLRun's model-monitoring stream pod over HTTP.
The example model is a toy credit-approval model with feature schema
[age, income, credit_score, balance] and label [approved]. Input rows come
from a small credit_data.csv.
This page covers three flows. The fourth flow is covered in Run model monitoring on a runtime application.
In this notebook
Prerequisites
A running MLRun cluster with model monitoring available.
Permission to create datastore profiles and set model monitoring credentials on the project.
This notebook runs from a Jupyter service that can reach the MLRun API and the model monitoring stream pod.
Overview#
The four flows to track externally-served model converge on the same mechanism: a USER_EP model endpoint plus
prediction events POSTed to the model monitoring stream pod over HTTP. Whether
the model runs as a Nuclio function, a Flask sidecar, or an external service, it
gets first-class monitoring in the MLRun UI.
Flow |
Usage |
Runtime |
Endpoint wiring |
Routing at invoke |
|---|---|---|---|---|
Stable/custom endpoint name, explicit input/output schemas (for per-feature drift), a specific creation_strategy, or multiple endpoints on one function. |
|
|
body: |
|
MLRun can't inject env vars (an external service, another cluster) |
|
|
body: |
|
Model monitoring on a runtime application |
|
|
body: |
|
Monitoring "on" with sensible defaults and an auto-named endpoint; the quickest path |
any |
|
body: |
Create the project#
Create (or reuse) the project and pick the MLRun image the functions run on.
import json
import time

import pandas as pd

import mlrun
from mlrun import get_or_create_project
from mlrun.common.schemas.model_monitoring import ModelEndpointInstruction
from mlrun.common.schemas.model_monitoring.constants import (
    ModelEndpointCreationStrategy,
)
from mlrun.datastore.datastore_profile import DatastoreProfileV3io

image = "mlrun/mlrun"
project_name = "http-ingest-demo-1"
project = get_or_create_project(project_name, context="./", allow_cross_project=True)
Prepare the input data#
Load the sample credit dataset. Each row becomes one prediction event that is POSTed to the model monitoring stream pod, so the feature columns match the model's input schema.
feature_names = ["age", "income", "credit_score", "balance"]
label_names = ["approved"]

df = pd.read_csv("credit_data.csv")
df.head()
| age | income | credit_score | balance | approved | |
|---|---|---|---|---|---|
| 0 | 61 | 50029 | 699 | 11462 | 1 |
| 1 | 27 | 111364 | 752 | 6459 | 1 |
| 2 | 22 | 47548 | 523 | 24762 | 0 |
| 3 | 66 | 107762 | 641 | 10682 | 0 |
| 4 | 72 | 143643 | 704 | 8795 | 1 |
# One HTTP event is pushed per row. Use a sample to keep the demo quick;
# raise/remove the sample for a fuller drift picture.
sample = df.sample(n=50, random_state=0)
data_points = sample[feature_names].astype(float).values.tolist()
len(data_points)
50
Enable model monitoring#
Register the datastore profiles (TSDB and stream), set the monitoring credentials, and enable monitoring on the project. Enabling monitoring deploys the built-in infrastructure, including the stream pod that events are pushed to.
from mlrun.datastore.datastore_profile import (
    DatastoreProfileKafkaStream,
    DatastoreProfilePostgreSQL,
)

# Create and register TSDB profile
tsdb_profile = DatastoreProfilePostgreSQL(
    name="timescaledb-tsdb-profile",
    user="postgres",
    password="postgres",
    host=f"timescaledb.{mlrun_namespace}.svc.cluster.local",
    port="5432",
    database="postgres",
)
project.register_datastore_profile(tsdb_profile)

# Create and register stream profile
stream_profile = DatastoreProfileKafkaStream(
    name="kafka-stream-profile",
    brokers=f"kafka-stream.{mlrun_namespace}.svc.cluster.local:9092",
    topics=[],
)
project.register_datastore_profile(stream_profile)

# Set model monitoring credentials and enable the infrastructure
project.set_model_monitoring_credentials(
    tsdb_profile_name=tsdb_profile.name,
    stream_profile_name=stream_profile.name,
)
project.enable_model_monitoring(base_period=1, image=image, wait_for_deployment=True)
Deploy a monitoring application#
A model monitoring application runs on the base_period schedule for each
tracked endpoint and writes results (drift, performance, …) that show up in the
UI. This demo app emits two result rows per cycle so there's always something to
see.
%%writefile monitoring_app.py
# A minimal model monitoring application. It runs on the base_period schedule
# for every tracked endpoint and emits two result rows per cycle (a drift result
# and a performance result), so the UI always has something to show.
from mlrun.common.schemas.model_monitoring.constants import (
    ResultKindApp,
    ResultStatusApp,
)
from mlrun.model_monitoring.applications import (
    ModelMonitoringApplicationBase,
    ModelMonitoringApplicationResult,
)


class DemoMonitoringApp(ModelMonitoringApplicationBase):
    NAME = "monitoring-test"

    def do_tracking(self, monitoring_context):
        monitoring_context.logger.info(
            "Demo monitoring app running",
            sample_df_len=len(monitoring_context.sample_df),
            endpoint=monitoring_context.model_endpoint.metadata.name,
        )
        return [
            ModelMonitoringApplicationResult(
                name="data_drift_test",
                value=2.15,
                kind=ResultKindApp.data_drift,
                status=ResultStatusApp.detected,
            ),
            ModelMonitoringApplicationResult(
                name="model_perf",
                value=80,
                kind=ResultKindApp.model_performance,
                status=ResultStatusApp.no_detection,
            ),
        ]
app_fn = project.set_model_monitoring_function(
    func="monitoring_app.py",
    application_class="DemoMonitoringApp",
    name="monitoring-test",
    image=image,
)
project.deploy_function(app_fn)
The flow until here is common for all flows. Continue with one of:
Env-driven flow#
Write the model-application code#
The cell below writes the application handler to user_application.py. It scores
each row with a toy model and pushes one prediction event per row to the stream
pod. Routing (endpoint UID + stream URL) is resolved body-first, env-fallback.
%%writefile user_application.py
# A user model served as a plain Nuclio function (kind="remote").
#
# The handler scores each input row with a toy credit-approval model and pushes
# one prediction event per row to the model monitoring stream pod over HTTP.
#
import json
import os

import requests

FEATURE_NAMES = ["age", "income", "credit_score", "balance"]
LABEL_NAMES = ["approved"]


def _predict(row: list[float]) -> list[float]:
    """Toy credit-approval model: approve when (income + balance)/2 >= credit_score."""
    _age, income, credit_score, balance = row
    return [1.0 if (income + balance) / 2.0 >= credit_score else 0.0]


def _resolve_routing(body: dict) -> tuple[str, str, str]:
    """Return (monitoring_url, endpoint_uid, endpoint_name). Body wins over env."""
    monitoring_url = body.get("model_monitoring_url") or os.environ.get(
        "MODEL_MONITORING_URL", ""
    )
    endpoint_uid = body.get("model_endpoint_uid") or os.environ.get(
        "MODEL_ENDPOINT_UID", ""
    )
    endpoint_name = body.get("model_endpoint_name") or os.environ.get(
        "MODEL_ENDPOINT_NAME", ""
    )
    return monitoring_url, endpoint_uid, endpoint_name


def handler(context, event):
    body = event.body
    if isinstance(body, (bytes, bytearray)):
        body = json.loads(body) if body else {}
    body = body or {}

    monitoring_url, endpoint_uid, endpoint_name = _resolve_routing(body)
    if not monitoring_url or not endpoint_uid:
        return context.Response(
            body="Missing model_monitoring_url / model_endpoint_uid "
            "(pass in the body or inject as env vars).",
            status_code=503,
            content_type="text/plain",
        )

    inputs_list = body.get("inputs") or []
    if not inputs_list:
        return context.Response(
            body="No 'inputs' provided", status_code=400, content_type="text/plain"
        )

    monitoring_url = monitoring_url.rstrip("/")
    predictions, pushed = [], 0
    for row in inputs_list:
        outputs = _predict([float(v) for v in row])
        predictions.append(outputs)
        # One prediction event per row -> the model-monitoring stream pod.
        resp = requests.post(
            monitoring_url,
            json={
                "model_endpoint_uid": endpoint_uid,
                "model_endpoint_name": endpoint_name,
                "inputs": dict(zip(FEATURE_NAMES, [float(v) for v in row])),
                "outputs": dict(zip(LABEL_NAMES, outputs)),
            },
            timeout=10,
        )
        if resp.status_code == 202:
            pushed += 1
        else:
            context.logger.warn(f"stream pod rejected row: {resp.status_code} {resp.text}")

    context.logger.info(f"scored {len(inputs_list)} rows, stream pod accepted {pushed}")
    return context.Response(
        body=json.dumps({"predictions": predictions, "pushed": pushed}),
        status_code=200,
        content_type="application/json",
    )
Set up the endpoint and the env variables#
fn.setup_model_monitoring(...) tells MLRun to register a USER_EP model
endpoint when the function deploys, and to inject the routing values
(MODEL_MONITORING_URL, MODEL_ENDPOINT_UID, MODEL_ENDPOINT_NAME) into the
Nuclio pod as environment variables. The handler reads them from
os.environ — the invocation body only carries inputs.
endpoint_name_1 = "http-ingest-ep-env"

func1 = project.set_function(
    func="user_application.py",
    name="user-application",
    image=image,
    kind="remote",
)
func1.setup_model_monitoring(
    general_model_endpoint_instructions=ModelEndpointInstruction(
        name=endpoint_name_1,
        input_schema=feature_names,
        output_schema=label_names,
    ),
)
func1.deploy()
> 2026-07-05 08:48:39,521 [info] Starting remote function deploy
2026-07-05 08:48:39  (info) Deploying function
2026-07-05 08:48:39  (info) Building
2026-07-05 08:48:39  (info) Staging files and preparing base images
2026-07-05 08:48:39  (warn) Using user provided base image, runtime interpreter version is provided by the base image
2026-07-05 08:48:39  (info) Building processor image
2026-07-05 08:50:36  (info) Build complete
2026-07-05 08:50:54  (info) Function deploy complete
> 2026-07-05 08:50:56,879 [info] Successfully deployed function: {"external_invocation_urls":["http-ingest-demo-1-user-application.default-tenant.app.vmdev55.lab.iguazeng.com/"],"internal_invocation_urls":["nuclio-http-ingest-demo-1-user-application.default-tenant.svc.cluster.local:8080"]}
'http://http-ingest-demo-1-user-application.default-tenant.app.vmdev55.lab.iguazeng.com/'
Invoke it — routing comes from the injected env vars, so the body is just
inputs.
time.sleep(5)  # let the endpoint registration settle

run_db = mlrun.get_run_db()
endpoint_uid_1 = (
    run_db.list_model_endpoints(project=project_name, names=endpoint_name_1)
    .endpoints[0]
    .metadata.uid
)
print(f"deploy #1 endpoint: name={endpoint_name_1!r} uid={endpoint_uid_1!r}")

result_1 = func1.invoke("/", body=json.dumps({"inputs": data_points}))
result_1
deploy #1 endpoint: name='http-ingest-ep-env' uid='e874b9332cc542fe92a838816b4372f9'
{'predictions': [[1.0],
  [1.0],
  [1.0],
  [1.0],
  ...,
  [1.0],
  [1.0],
  [1.0],
  [1.0]],
 'pushed': 50}
Event-driven flow#
This is the flow to use when the model runs somewhere MLRun can't inject env vars (an external service, another cluster). You drive the wiring yourself and pass the routing values in the request body instead of relying on env injection:
project.create_user_model_endpoint(...)registers theUSER_EPand returns(name, uid).project.get_model_monitoring_url()returns the internal HTTP URL of the monitoring stream pod.The function is deployed without
setup_model_monitoring()— no env vars are injected.
func2 = project.set_function(
    func="user_application.py",
    name="user-application-2",
    image=image,
    kind="remote",
)
func2.save()

endpoint_name_2, endpoint_uid_2 = project.create_user_model_endpoint(
    name="http-ingest-ep-event",
    input_schema=feature_names,
    output_schema=label_names,
    function_name="user-application-2",
    function_tag="latest",
    creation_strategy=ModelEndpointCreationStrategy.OVERWRITE,
)
monitoring_url = project.get_model_monitoring_url()
print(f"deploy #2 endpoint: name={endpoint_name_2!r} uid={endpoint_uid_2!r}")
print(f"monitoring URL: {monitoring_url}")

# No setup_model_monitoring() — this flow is event-driven.
func2.deploy()
deploy #2 endpoint: name='http-ingest-ep-event' uid='42040e490b5742c28468c366820e19f1'
monitoring URL: http://nuclio-http-ingest-demo-1-model-monitoring-stream.default-tenant.svc.cluster.local:8080
> 2026-07-05 08:51:03,184 [info] Starting remote function deploy
2026-07-05 08:51:03  (info) Deploying function
2026-07-05 08:51:03  (info) Building
2026-07-05 08:51:03  (info) Staging files and preparing base images
2026-07-05 08:51:03  (warn) Using user provided base image, runtime interpreter version is provided by the base image
2026-07-05 08:51:03  (info) Building processor image
2026-07-05 08:53:01  (info) Build complete
2026-07-05 08:53:55  (info) Function deploy complete
> 2026-07-05 08:53:55,611 [info] Successfully deployed function: {"external_invocation_urls":["http-ingest-demo-1-user-application-2.default-tenant.app.vmdev55.lab.iguazeng.com/"],"internal_invocation_urls":["nuclio-http-ingest-demo-1-user-application-2.default-tenant.svc.cluster.local:8080"]}
'http://http-ingest-demo-1-user-application-2.default-tenant.app.vmdev55.lab.iguazeng.com/'
Invoke it — the routing values travel inside the body, and the handler picks them up (body wins over env).
result_2 = func2.invoke(
    "/",
    body=json.dumps(
        {
            "inputs": data_points,
            "model_endpoint_uid": endpoint_uid_2,
            "model_endpoint_name": endpoint_name_2,
            "model_monitoring_url": monitoring_url,
        }
    ),
)
result_2
{'predictions': [[1.0],
  [1.0],
  [1.0],
  [1.0],
  [1.0],
  ...,
  [1.0],
  [1.0],
  [1.0],
  [1.0]],
 'pushed': 50}
Default flow (track_models=True)#
The env-driven and event-driven flows named the endpoint and passed explicit schemas. When you don't
need any of that, just pass track_models=True to deploy().
The runtime creates one default model endpoint for the function and injects the model monitoring env vars for you:
func = project.set_function(func="user_application.py", name="user-application",
                            image=image, kind="remote")
func.deploy(track_models=True)     # <- that's it
What you get by default#
deploy(track_models=True) (with no instructions set) calls
setup_model_monitoring() with no arguments, which creates a single USER_EP
with these defaults:
Setting |
Default value |
Notes |
|---|---|---|
Endpoint name |
|
e.g. function |
Endpoint type |
|
user-defined endpoint (not backed by a serving graph) |
function_tag |
|
derived from the function's |
input_schema / output_schema |
|
ingestion works, but there's no per-feature drift |
creation_strategy |
|
if an endpoint with this name exists, update its |
monitoring_mode |
|
endpoint is actively monitored |
track_models |
|
set automatically by the call |
View the results in the UI#
Prediction events flow into the stream pod, get batched to the TSDB, and the
monitoring application writes results on the base_period schedule. Everything
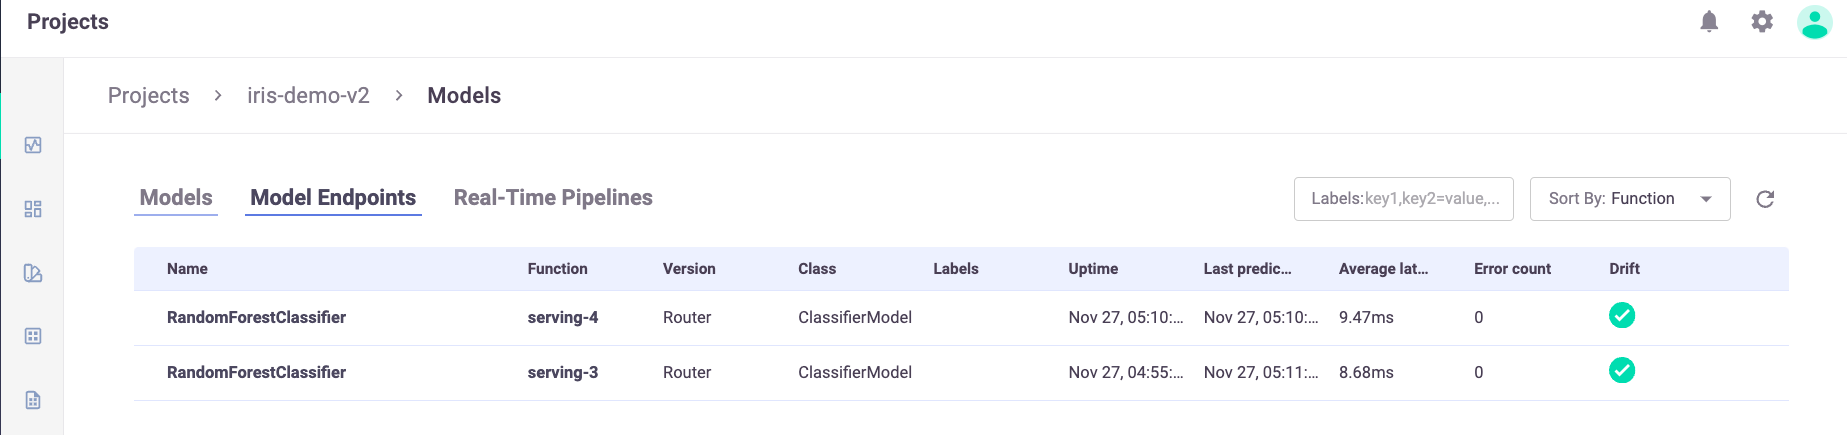
is visible in the MLRun UI under Projects →
For each endpoint you can see the last request time, the incoming feature values, prediction counts, and the monitoring-app results (drift / performance).
The two remote endpoints, http-ingest-ep-env and http-ingest-ep-event,
appear in the Model Endpoints list with incoming prediction traffic.